


















Are BTTS frequencies predictions?
No. They describe the share of observed matches in which both teams scored. Next-match probabilities are computed separately by the model and depend on the opponent.
Ligue 1 · Statistics, goal patterns, form and match projections.
Frequencies computed from every result in the snapshot. Every percentage retains its match count.
Observed frequencies ≠ next-match probabilities. Results through 23 October 2026 · Wikipedia · CC BY-SA 4.0 ↗
Total goals, both teams to score and clean sheets. O1.5 / O2.5 / O3.5 mean at least 2 / 3 / 4 goals.
Observed league distribution, all venues.
64 observed matches. The final bucket includes higher totals.
| Goals | 0 | 1 | 2 | 3 | 4 | 5 | 6+ |
|---|---|---|---|---|---|---|---|
| N | 4 | 9 | 10 | 17 | 15 | 4 | 5 |
| % | 6% | 14% | 16% | 27% | 23% | 6% | 8% |
Observed frequencies, not next-match probabilities. N = matches; each club match is counted once per row.
Sort columns, filter by venue and download the selection. This statistical ordering does not apply official sanctions or tie-break rules.
On mobile: scroll the table horizontally. Select a heading to sort.
| Club | |||||||||||
|---|---|---|---|---|---|---|---|---|---|---|---|
| AS Monaco | 7 | 2.00 | 10 | 6 | 2.29 | 71%5/7 | 43%3/7 | 14%1/7 | 57%4/7 | 29%2/7 | 14%1/7 |
| LOSC Lille | 7 | 2.00 | 10 | 5 | 2.14 | 71%5/7 | 29%2/7 | 14%1/7 | 43%3/7 | 57%4/7 | 0%0/7 |
| Olympique Lyonnais | 7 | 2.00 | 13 | 5 | 2.57 | 86%6/7 | 57%4/7 | 29%2/7 | 57%4/7 | 43%3/7 | 14%1/7 |
| Paris FC | 7 | 2.00 | 12 | 7 | 2.71 | 57%4/7 | 57%4/7 | 29%2/7 | 43%3/7 | 43%3/7 | 43%3/7 |
| Paris Saint-Germain | 7 | 2.00 | 14 | 9 | 3.29 | 86%6/7 | 86%6/7 | 57%4/7 | 86%6/7 | 14%1/7 | 0%0/7 |
| Stade Rennais | 7 | 1.86 | 15 | 14 | 4.14 | 86%6/7 | 86%6/7 | 71%5/7 | 71%5/7 | 14%1/7 | 14%1/7 |
| FC Lorient | 7 | 1.57 | 7 | 6 | 1.86 | 43%3/7 | 43%3/7 | 14%1/7 | 43%3/7 | 57%4/7 | 14%1/7 |
| RC Lens | 7 | 1.43 | 14 | 11 | 3.57 | 86%6/7 | 86%6/7 | 43%3/7 | 86%6/7 | 0%0/7 | 14%1/7 |
| OGC Nice | 8 | 1.38 | 8 | 10 | 2.25 | 75%6/8 | 63%5/8 | 0%0/8 | 63%5/8 | 13%1/8 | 38%3/8 |
| AJ Auxerre | 7 | 1.29 | 11 | 17 | 4.00 | 86%6/7 | 86%6/7 | 71%5/7 | 86%6/7 | 14%1/7 | 0%0/7 |
| Olympique de Marseille | 7 | 1.29 | 14 | 10 | 3.43 | 86%6/7 | 57%4/7 | 43%3/7 | 43%3/7 | 29%2/7 | 29%2/7 |
| Toulouse FC | 7 | 1.29 | 12 | 11 | 3.29 | 86%6/7 | 71%5/7 | 57%4/7 | 57%4/7 | 14%1/7 | 29%2/7 |
| Stade Brestois | 8 | 1.13 | 14 | 12 | 3.25 | 88%7/8 | 75%6/8 | 38%3/8 | 88%7/8 | 0%0/8 | 13%1/8 |
| Angers SCO | 7 | 1.00 | 9 | 15 | 3.43 | 86%6/7 | 57%4/7 | 43%3/7 | 57%4/7 | 29%2/7 | 29%2/7 |
| RC Strasbourg | 7 | 1.00 | 12 | 15 | 3.86 | 100%7/7 | 86%6/7 | 43%3/7 | 86%6/7 | 0%0/7 | 14%1/7 |
| Le Mans FC | 7 | 0.86 | 10 | 15 | 3.57 | 100%7/7 | 86%6/7 | 57%4/7 | 86%6/7 | 0%0/7 | 14%1/7 |
| ESTAC Troyes | 7 | 0.57 | 5 | 16 | 3.00 | 86%6/7 | 43%3/7 | 29%2/7 | 43%3/7 | 14%1/7 | 57%4/7 |
| Le Havre AC | 7 | 0.29 | 5 | 11 | 2.29 | 57%4/7 | 43%3/7 | 29%2/7 | 57%4/7 | 14%1/7 | 43%3/7 |
Compare home and away points per game, then the distribution of results.
Hover or focus a point for its sample size. Small home/away samples remain unstable.
Only dated matches whose scores agree with the matrix are included. Partial coverage is never presented as a complete recent sequence.
Match-spaced, not a continuous time axis. Undated results are excluded.
Score from the selected club’s perspective. Dates are never inferred from matrix row order.
| Date | Opponent | Venue | Club score | Points | +2.5 | BTTS | Source |
|---|---|---|---|---|---|---|---|
| 17 October 2026 | RC Strasbourg | Away | 3–1 | 3 | ✓ | ✓ | Revision ↗ |
| 10 October 2026 | Le Mans FC | Home | 3–1 | 3 | ✓ | ✓ | Revision ↗ |
| 20 September 2026 | Olympique de Marseille | Away | 2–1 | 3 | ✓ | ✓ | Revision ↗ |
| 13 September 2026 | Stade Brestois | Away | 1–0 | 3 | — | — | Revision ↗ |
| 4 September 2026 | AS Monaco | Home | 1–2 | 0 | ✓ | ✓ | Revision ↗ |
| 28 August 2026 | LOSC Lille | Away | 2–2 | 1 | ✓ | ✓ | Revision ↗ |
| 23 August 2026 | Stade Rennais | Away | 2–2 | 1 | ✓ | ✓ | Revision ↗ |
Choose a fixture in the next 28 days. Explore outcome probabilities and the score distribution.
Published 23/10/2026, 16:33:48 · Europe/Paris
This first projection stays unchanged after the match, even as the data evolves.
hexagone-poisson-history-v2 · Stade Rennais / RC Strasbourg · JSON archive and input data63 league matches · 7/7 matches per team · limited sample.
+ 610 historical matches · decaying weights · 365-day half-life
A map of every scoreline.
Each cell = a probability in %. Scores beyond 5 goals: 3.9%.
Model distribution of total goals.
A probability, never a promised result.
These eight scorelines cover only part of the distribution.
| Scenario | Model probability | Theoretical no-margin odds | Interpretation |
|---|---|---|---|
| 1 · Home win | 59.6% | 1.68 | 1 ÷ probability. No bookmaker quote. |
| X · Draw | 19.0% | 5.27 | 1 ÷ probability. No bookmaker quote. |
| 2 · Away win | 21.5% | 4.66 | 1 ÷ probability. No bookmaker quote. |
| 1X · Home or draw | 78.5% | 1.27 | 1 ÷ probability. No bookmaker quote. |
| 12 · Either team wins | 81.0% | 1.23 | 1 ÷ probability. No bookmaker quote. |
| X2 · Draw or away | 40.4% | 2.47 | 1 ÷ probability. No bookmaker quote. |
| BTTS · Yes | 68.8% | 1.45 | 1 ÷ probability. No bookmaker quote. |
| BTTS · No | 31.2% | 3.20 | 1 ÷ probability. No bookmaker quote. |
| Over 0.5 goals | 97.8% | 1.02 | 1 ÷ probability. No bookmaker quote. |
| Under 0.5 goals | 2.2% | 45.51 | 1 ÷ probability. No bookmaker quote. |
| Over 1.5 goals | 89.4% | 1.12 | 1 ÷ probability. No bookmaker quote. |
| Under 1.5 goals | 10.6% | 9.45 | 1 ÷ probability. No bookmaker quote. |
| Over 2.5 goals | 73.4% | 1.36 | 1 ÷ probability. No bookmaker quote. |
| Under 2.5 goals | 26.6% | 3.76 | 1 ÷ probability. No bookmaker quote. |
| Over 3.5 goals | 53.0% | 1.89 | 1 ÷ probability. No bookmaker quote. |
| Under 3.5 goals | 47.0% | 2.13 | 1 ÷ probability. No bookmaker quote. |
| Over 4.5 goals | 33.6% | 2.98 | 1 ÷ probability. No bookmaker quote. |
| Under 4.5 goals | 66.4% | 1.51 | 1 ÷ probability. No bookmaker quote. |
Odds are computed from the model, without margin or commission. These markets are correlated: their probabilities must not be multiplied as if independent.
Enter three decimal 1X2 odds to compare their implied probabilities with the model. Fields start empty: no odds feed is connected.
Values must exceed 1. Margin is removed proportionally, one of several possible methods. A difference from the model does not establish profitability.
Your comparison will appear here.
Available 2022/23–2025/26 archives and dated 2026/27 results. Ligue 2 2025/26 is partial: meetings are not exhaustive.
| Date | Season | Home | Score | Away | BTTS | +2.5 | Source |
|---|---|---|---|---|---|---|---|
| 19 April 2026 | 2025/26 | RC Strasbourg | 0–3 | Stade Rennais | — | ✓ | Source ↗ |
| 2 November 2025 | 2025/26 | Stade Rennais | 4–1 | RC Strasbourg | ✓ | ✓ | Source ↗ |
| 2 February 2025 | 2024/25 | Stade Rennais | 1–0 | RC Strasbourg | — | — | Source ↗ |
| 25 August 2024 | 2024/25 | RC Strasbourg | 3–1 | Stade Rennais | ✓ | ✓ | Source ↗ |
| 31 March 2024 | 2023/24 | RC Strasbourg | 2–0 | Stade Rennais | — | — | Source ↗ |
| 29 October 2023 | 2023/24 | Stade Rennais | 1–1 | RC Strasbourg | ✓ | — | Source ↗ |
| 1 February 2023 | 2022/23 | Stade Rennais | 3–0 | RC Strasbourg | — | ✓ | Source ↗ |
| 1 October 2022 | 2022/23 | RC Strasbourg | 1–3 | Stade Rennais | ✓ | ✓ | Source ↗ |
Documented fixtures in the next 28 days. Model probabilities, not market odds. Times are Europe/Paris.
| Date | Fixture | 1 | X | 2 | O2.5 goals | BTTS | Sample |
|---|---|---|---|---|---|---|---|
| 25 OctTBC | Stade RennaisRC Strasbourg | 59.6% | 19.0% | 21.5% | 73.4% | 68.8% | 7/7team matches |
| 25 OctTBC | Angers SCOFC Lorient | 27.0% | 28.9% | 44.0% | 36.6% | 42.6% | 7/7team matches |
| 25 OctTBC | AJ AuxerreLe Mans FC | 46.9% | 25.6% | 27.5% | 48.7% | 52.2% | 7/7team matches |
| 25 Oct15:00 | AS MonacoLOSC Lille | 38.6% | 28.1% | 33.3% | 41.2% | 47.3% | 7/7team matches |
| 25 Oct17:15 | Olympique de MarseilleLe Havre AC | 62.4% | 19.9% | 17.8% | 62.8% | 58.2% | 7/7team matches |
| 25 Oct20:45 | Paris Saint-GermainOlympique Lyonnais | 48.4% | 26.1% | 25.5% | 45.4% | 49.1% | 7/7team matches |
| 30 OctTBC | LOSC LilleRC Lens | 44.1% | 26.4% | 29.4% | 46.3% | 50.8% | 7/7team matches |
| 30 Oct19:00 | Le Havre ACParis Saint-Germain | 11.5% | 19.6% | 68.9% | 50.8% | 43.0% | 7/7team matches |
| 31 OctTBC | OGC NiceStade Rennais | 53.4% | 22.2% | 24.4% | 61.0% | 60.4% | 7/7team matches |
| 31 OctTBC | FC LorientStade Brestois | 48.1% | 25.3% | 26.6% | 49.1% | 52.2% | 7/7team matches |
| 31 OctTBC | ESTAC TroyesLe Mans FC | 29.7% | 23.0% | 47.3% | 61.7% | 62.6% | 7/7team matches |
| 31 Oct20:45 | Olympique LyonnaisAngers SCO | 70.4% | 18.1% | 11.5% | 57.3% | 47.7% | 7/7team matches |
| 1 NovTBC | RC StrasbourgAJ Auxerre | 56.8% | 19.7% | 23.5% | 72.2% | 68.7% | 7/7team matches |
| 1 NovTBC | Paris FCAS Monaco | 46.0% | 25.8% | 28.2% | 48.2% | 51.9% | 7/7team matches |
| 1 Nov20:45 | Olympique de MarseilleToulouse FC | 43.5% | 21.4% | 35.2% | 72.2% | 71.4% | 7/7team matches |
| 6 NovTBC | Toulouse FCRC Strasbourg | 33.4% | 22.9% | 43.7% | 63.7% | 64.7% | 7/7team matches |
| 7 NovTBC | AJ AuxerreParis FC | 36.7% | 31.0% | 32.3% | 31.8% | 39.4% | 7/7team matches |
| 7 Nov20:45 | Paris Saint-GermainESTAC Troyes | 65.8% | 19.9% | 14.3% | 56.2% | 50.2% | 7/7team matches |
| 8 NovTBC | Le Havre ACFC Lorient | 23.7% | 33.1% | 43.2% | 24.7% | 31.9% | 7/7team matches |
| 8 NovTBC | Angers SCOOGC Nice | 41.8% | 26.7% | 31.5% | 46.1% | 50.9% | 7/7team matches |
| 8 Nov15:00 | Stade RennaisLOSC Lille | 39.5% | 27.4% | 33.1% | 43.7% | 49.2% | 7/7team matches |
| 8 Nov17:15 | Stade BrestoisOlympique Lyonnais | 41.0% | 26.8% | 32.3% | 46.0% | 51.0% | 7/7team matches |
| 8 Nov17:15 | Le Mans FCAS Monaco | 31.6% | 25.9% | 42.5% | 49.4% | 53.6% | 7/7team matches |
| 8 Nov20:45 | RC LensOlympique de Marseille | 46.1% | 24.0% | 29.8% | 56.9% | 59.0% | 7/7team matches |
| 20 NovTBC | ESTAC TroyesLe Havre AC | 30.7% | 25.7% | 43.6% | 50.0% | 53.9% | 7/7team matches |
| 21 NovTBC | Paris FCAngers SCO | 61.9% | 21.0% | 17.1% | 56.5% | 52.9% | 7/7team matches |
| 21 NovTBC | RC LensToulouse FC | 43.9% | 23.1% | 33.0% | 62.6% | 63.8% | 7/7team matches |
| 21 NovTBC | RC StrasbourgStade Brestois | 46.5% | 24.1% | 29.4% | 56.0% | 58.2% | 7/7team matches |
| 21 Nov17:15 | OGC NiceParis Saint-Germain | 26.3% | 26.1% | 47.6% | 46.0% | 49.7% | 7/7team matches |
| 21 Nov20:45 | LOSC LilleOlympique Lyonnais | 40.4% | 31.4% | 28.2% | 30.1% | 37.5% | 7/7team matches |
| 21 Nov20:45 | AS MonacoAJ Auxerre | 70.7% | 15.7% | 13.6% | 75.2% | 64.6% | 7/7team matches |
Matches included through 23 October 2026Wikipedia · CC BY-SA 4.0
Who scores? Who holds firm? Compare clubs using every result in the snapshot.
Every crest tells a story. Select one to explore.
Top left: more goals scored, fewer conceded. Dashed lines: league average.
Five observed metrics. Two profiles.
Scales are relative to the league. ¹ Share of matches with no goal conceded.
LOSC Lille
7 matches in snapshot
| Metric | LOSC Lille | Angers SCO |
|---|---|---|
| Goals for | 10 | 9 |
| Goals against | 5 | 15 |
| Wins | 4 | 2 |
| Draws | 2 | 1 |
| Losses | 1 | 4 |
Matches included through 23 October 2026Wikipedia · CC BY-SA 4.0
Documented goals and squad composition. Every chart shows its actual coverage.
Documented scorer selection · goals scored
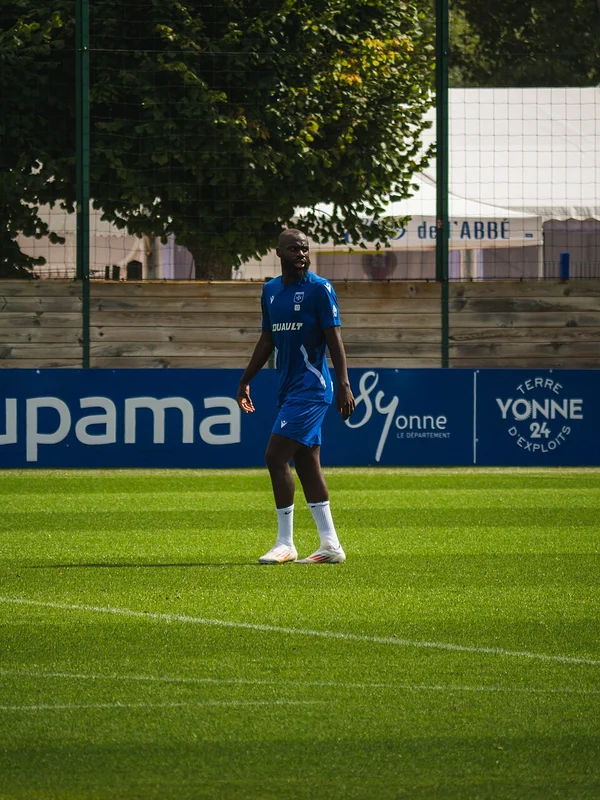 Lassine SinayokoParis FC6
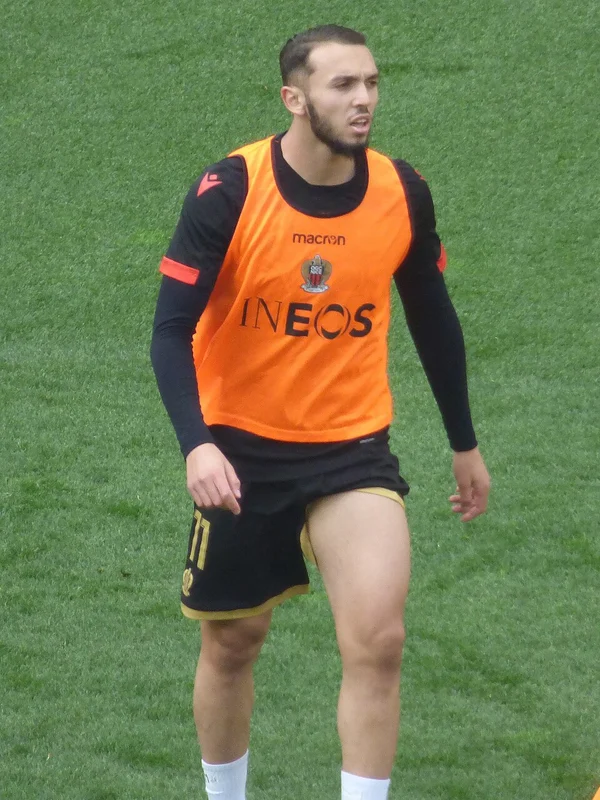 Amine GouiriOlympique de Marseille5CTCasper TengstedtToulouse FC5
 Cameron ArcherAJ Auxerre4PBParis BrunnerAS Monaco4KDKamory DoumbiaStade Brestois4LMLouis MafoutaLe Mans FC4
 Ferran TorresParis Saint-Germain4ABAdil BourabaaLe Mans FC3
 MarquinhosParis Saint-Germain3DNDanny NamasoAJ Auxerre3
 Ernest NuamahOlympique Lyonnais3
 Florian ThauvinRC Lens3
Partial coverage. The source does not specify its cut-off date. An absent player does not necessarily have zero goals. Source ↗
Select an age group to discover its players.
+ 431 other players in this selection
Ages calculated today from verified birth dates. Unknown or conflicting dates are excluded.
Available sources do not yet cover minutes, shots, passing or xG. Performance statistics are limited to documented facts.
| # | Player | Club | Goals |
|---|---|---|---|
| 1 | Esteban Lepaul | Stade Rennais | 7 |
| 2 | Lassine Sinayoko | Paris FC | 6 |
| 3 | Amine Gouiri | Olympique de Marseille | 5 |
| 3 | Casper Tengstedt | Toulouse FC | 5 |
| 5 | Cameron Archer | AJ Auxerre | 4 |
| 5 | Paris Brunner | AS Monaco | 4 |
| 5 | Kamory Doumbia | Stade Brestois | 4 |
| 5 | Louis Mafouta | Le Mans FC | 4 |
| 5 | Ferran Torres | Paris Saint-Germain | 4 |
| 10 | Adil Bourabaa | Le Mans FC | 3 |
| 10 | Marquinhos | Paris Saint-Germain | 3 |
| 10 | Danny Namaso | AJ Auxerre | 3 |
| 10 | Ernest Nuamah | Olympique Lyonnais | 3 |
| 10 | Florian Thauvin | RC Lens | 3 |
Minutes and starts are unavailable: no per-90 rate or scorer probability is calculated. The source does not state its cutoff. Source ↗
| Club | Players | Birth dates | Mean age | Median | U21 |
|---|---|---|---|---|---|
| RC Strasbourg | 30 | 29/30 | 21.1 | 21.0 | 11/29 known |
| Toulouse FC | 24 | 22/24 | 22.2 | 21.0 | 9/22 known |
| AJ Auxerre | 31 | 26/31 | 23.9 | 24.0 | 3/26 known |
| AS Monaco | 30 | 25/30 | 24.4 | 23.0 | 5/25 known |
| Angers SCO | 24 | 21/24 | 24.4 | 24.0 | 5/21 known |
| Olympique Lyonnais | 26 | 26/26 | 24.7 | 25.0 | 5/26 known |
| Le Havre AC | 27 | 25/27 | 24.7 | 24.0 | 7/25 known |
| Paris Saint-Germain | 24 | 23/24 | 24.7 | 24.0 | 4/23 known |
| FC Lorient | 27 | 25/27 | 25.0 | 24.0 | 2/25 known |
| LOSC Lille | 25 | 25/25 | 25.2 | 24.0 | 5/25 known |
| Stade Brestois | 24 | 21/24 | 25.2 | 23.0 | 2/21 known |
| Stade Rennais | 26 | 25/26 | 25.5 | 26.0 | 4/25 known |
| OGC Nice | 29 | 26/29 | 26.0 | 26.0 | 3/26 known |
| Le Mans FC | 29 | 27/29 | 26.2 | 26.0 | 4/27 known |
| RC Lens | 29 | 28/29 | 26.3 | 25.5 | 4/28 known |
| Paris FC | 25 | 23/25 | 26.3 | 27.0 | 3/23 known |
| ESTAC Troyes | 28 | 21/28 | 26.5 | 26.0 | 2/21 known |
| Olympique de Marseille | 22 | 21/22 | 26.6 | 26.0 | 2/21 known |
Mean, median and U21 use verified birth dates only. U21 means under 21 today.
Current season: goals for and against, home/away performance, league means and sample sizes. In Ligue 1, the previous two seasons provide historical profiles; their weight halves every 365 days. Teams with little history are shrunk towards league averages.
| Season | Results | Last result | Coverage | Source |
|---|---|---|---|---|
| 2024/25 | 306 / 306 | 2025-05-17 | Complete | e6744429 ↗ |
| 2025/26 | 305 / 306 | 2026-05-17 | Partial | e6744429 ↗ |
Abandoned or administratively awarded matches are excluded from model fitting. Missing data stays unknown: shots, injuries and line-ups are never invented.
Retrospective comparison over 242 2025/26 matches: v1 Brier 0.6253 → v2 0.6243. The difference is small; this historical test does not establish future performance.
Football always has surprises. Our model estimates probabilities from goals and match venue.
Data and projections JSONLeague-frequency baseline Brier: 0.656 · Model log loss: 1.021
Historical v1 benchmark · 2022/23–2023/24. The v2 comparison is shown with the additional archives above.
Horizontal: model probability. Vertical: observed frequency (%). Each match contributes three evaluated outcome categories.
Independent Poisson model. Home/away averages are adjusted using each team’s goals scored and conceded. Five virtual games stabilise small samples. Ligue 2 (v1) uses league averages. Ligue 1 (v2) uses historical home/away profiles, themselves shrunk with eight league-prior matches; historical weight halves every 365 days. Parameters are fixed, without tuning on the displayed comparison. Score probabilities are aggregated into home win, draw and away win.
Retrospective evaluation on 2022/23 and 2023/24: each date is predicted using strictly earlier dates, after at least 60 league games. Every match sharing a date is evaluated before ingesting its results. This is not an independent prospective test.
Model means are not shot-based xG. Injuries, line-ups, fatigue and cards are not modelled. Undated current results are never used to invent recent form.
| Season | N | Brier | Baseline | Log loss |
|---|---|---|---|---|
| 2022/23 | 320 | 0.599 | 0.651 | 1.000 |
| 2023/24 | 243 | 0.635 | 0.662 | 1.049 |
No. They describe the share of observed matches in which both teams scored. Next-match probabilities are computed separately by the model and depend on the opponent.
Current results use Wikipedia score matrices reconciled with standings. Dated fixtures and squads have separate source revisions. Historical results come from OpenFootball. Source links and licences are retained.
No. Theoretical odds equal 1 divided by model probability, without margin. The comparison tool receives only the odds you enter; no bookmaker feed is connected.
A percentage alone hides sample size. N is the number of matches, and 4/7 means four occurrences in seven games. Missing values are not replaced with zeros.
By verified date, after matching the fixture and score against the matrix. With partial dated coverage, these are the latest five available results, not necessarily the latest five matches played.
Yes. Every page and guide has a French and English version, connected by the language switch. Exports use stable identifiers shared across both languages.